tnggraphics::TNGVisualize Class Reference
#include <TNGVisualize.h>
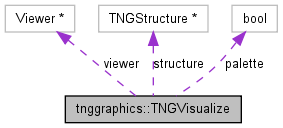
Collaboration diagram for tnggraphics::TNGVisualize:

Public Member Functions | |
| void | Autoscale (bool b=true) |
| void | Axes (bool b=true) |
| void | Colorize (bool b=true) |
| void | Draw (tngfem::TNGStructure *s, bool rescale, double scale) |
| void | Draw (tngfem::TNGStructure *s, double scale) |
| void | Draw (tngfem::TNGStructure *s, bool rescale) |
| void | Draw (tngfem::TNGStructure *s) |
| Draw a finite element model as defined by TNGStructure. | |
| void | Edges (bool b=true) |
| void | ElementResult (tngfem::TNGStructure *s, bool rescale, double scale) |
| void | ElementResult (tngfem::TNGStructure *s, double scale) |
| void | ElementResult (tngfem::TNGStructure *s) |
| void | Faces (bool b=true) |
| void | File (std::string file, int resolution=2, bool clip=true) |
| void | Frame (bool b=true) |
| void | Hold (bool b=true) |
| void | Lighting (bool b=true) |
| void | Logarithmic (bool x=true, bool y=true, bool z=true) |
| void | Palette (bool b=true) |
| void | Perspective (bool b=true) |
| void | Plot (const tmath::MatrixBlock &x, const tmath::MatrixBlock &y, double dotsize=0, int type=1, const tmath::Matrix &color=tmath::Matrix(0, 0)) |
| void | Plot (const tmath::MatrixBlock &x, tmath::Matrix &y, double dotsize=0, int type=1, const tmath::Matrix &color=tmath::Matrix(0, 0)) |
| void | Plot (tmath::Matrix &x, const tmath::MatrixBlock &y, double dotsize=0, int type=1, const tmath::Matrix &color=tmath::Matrix(0, 0)) |
| void | Plot (tmath::Matrix &x, tmath::Matrix &y, double dotsize=0, int type=1, const tmath::Matrix &color=tmath::Matrix(0, 0)) |
| void | Plot (const tmath::MatrixBlock &s, double dotsize=0, int type=1, const tmath::Matrix &color=tmath::Matrix(0, 0)) |
| void | Plot (tmath::Matrix &s, double dotsize=0, int type=1, const tmath::Matrix &color=tmath::Matrix(0, 0)) |
| void | Plot (double x, double y, double dotsize=0, int type=1, const tmath::Matrix &color=tmath::Matrix(0, 0)) |
| void | Plot3D (tmath::Matrix &s, double dotsize=0, int type=1, const tmath::Matrix &color=tmath::Matrix(0, 0)) |
| void | Plot3D (const tmath::MatrixBlock &s, double dotsize=0, int type=1, const tmath::Matrix &color=tmath::Matrix(0, 0)) |
| void | Plot3D (double x, double y, double z, double dotsize=0, int type=1, const tmath::Matrix &color=tmath::Matrix(0, 0)) |
| void | Posterize (int p=8) |
| void | SetAngles (double a, double b, double g) |
| void | SetLabels (std::string l, std::string x, std::string y, std::string z="") |
| void | SetPalette (double, double, int, int) |
| void | SetRanges (double xmin, double xmax, double ymin, double ymax, double zmin, double zmax) |
| void | SetRanges (double xmin, double xmax, double ymin, double ymax) |
| void | Shift (double dx, double dy, double dz) |
| void | Shift (double dx, double dy) |
| void | ShowNodes (double) |
| void | SPlot (const tmath::MatrixBlock &s, double xlo, double xhi, double ylo, double yhi, int nct=0, double from=0, double to=0) |
| void | SPlot (tmath::Matrix &s, double xlo, double xhi, double ylo, double yhi, int nct=0, double from=0, double to=0) |
| TNGVisualize (double l=50, double t=50, double w=600, double h=400, std::string title="TNGVisualize") | |
| Constructor. | |
| void | Vector (tngfem::TNGStructure *s, tmath::Matrix *vec, double scale) |
| void | Zoom (double fac1, double fac2) |
| void | Zoom (double z) |
Public Attributes | |
| bool | palette |
| tngfem::TNGStructure * | structure |
| Viewer * | viewer |
Detailed Description
Class defining a graphics window for plotting purposes.Constructor & Destructor Documentation
| tnggraphics::TNGVisualize::TNGVisualize | ( | double | l = 50, |
|
| double | t = 50, |
|||
| double | w = 600, |
|||
| double | h = 400, |
|||
| std::string | title = "TNGVisualize" | |||
| ) |
Constructor.
Constructors
Member Function Documentation
| void tnggraphics::TNGVisualize::Plot | ( | tmath::Matrix & | x, | |
| tmath::Matrix & | y, | |||
| double | dotsize = 0, |
|||
| int | type = 1, |
|||
| const tmath::Matrix & | color = tmath::Matrix(0, 0) | |||
| ) |
Plot the contents of a Matrix
- Parameters:
-
x abscissa values, must be one-dimensional (row or column vector) y ordinate values, values are plotted according to the orientation of x dotsize size of the plot symbol (0 for none) type type of plot symbol (0 circle, 1 square, 2 diamond, 3 uptriangle, 4 downtriangle, 5 sphere) Matrix of size (4,1) containing RGBA values of the plot
| void tnggraphics::TNGVisualize::Plot | ( | tmath::Matrix & | s, | |
| double | dotsize = 0, |
|||
| int | type = 1, |
|||
| const tmath::Matrix & | color = tmath::Matrix(0, 0) | |||
| ) |
Plot the contents of a Matrix, abscissa is computed from index, ordinates are plotted over the larger dimension of s
- Parameters:
-
dotsize size of the plot symbol (0 for none, negative for symbol only, positive for symbol+line) type type of plot symbol (0 circle, 1 square, 2 diamond, 3 uptriangle, 4 downtriangle, 5 sphere) Matrix of size (4,1) containing RGBA values of the plot
| void tnggraphics::TNGVisualize::Plot | ( | double | x, | |
| double | y, | |||
| double | dotsize = 0, |
|||
| int | type = 1, |
|||
| const tmath::Matrix & | color = tmath::Matrix(0, 0) | |||
| ) |
Plot a single point in 2D
- Parameters:
-
x abscissa y ordinate dotsize size of the plot symbol (0 for none) type type of plot symbol (0 circle, 1 square, 2 diamond, 3 uptriangle, 4 downtriangle, 5 sphere) Matrix of size (4,1) containing RGBA values of the plot symbol
The documentation for this class was generated from the following file:
- modules/tnggraphics/tnggraphics/TNGVisualize.h
 1.5.6
1.5.6